Analytics
The analytics page turns your findings and triage history into trends — so you can see how much is coming in, how fast you're clearing it, and what's been sitting too long.
What you'll see
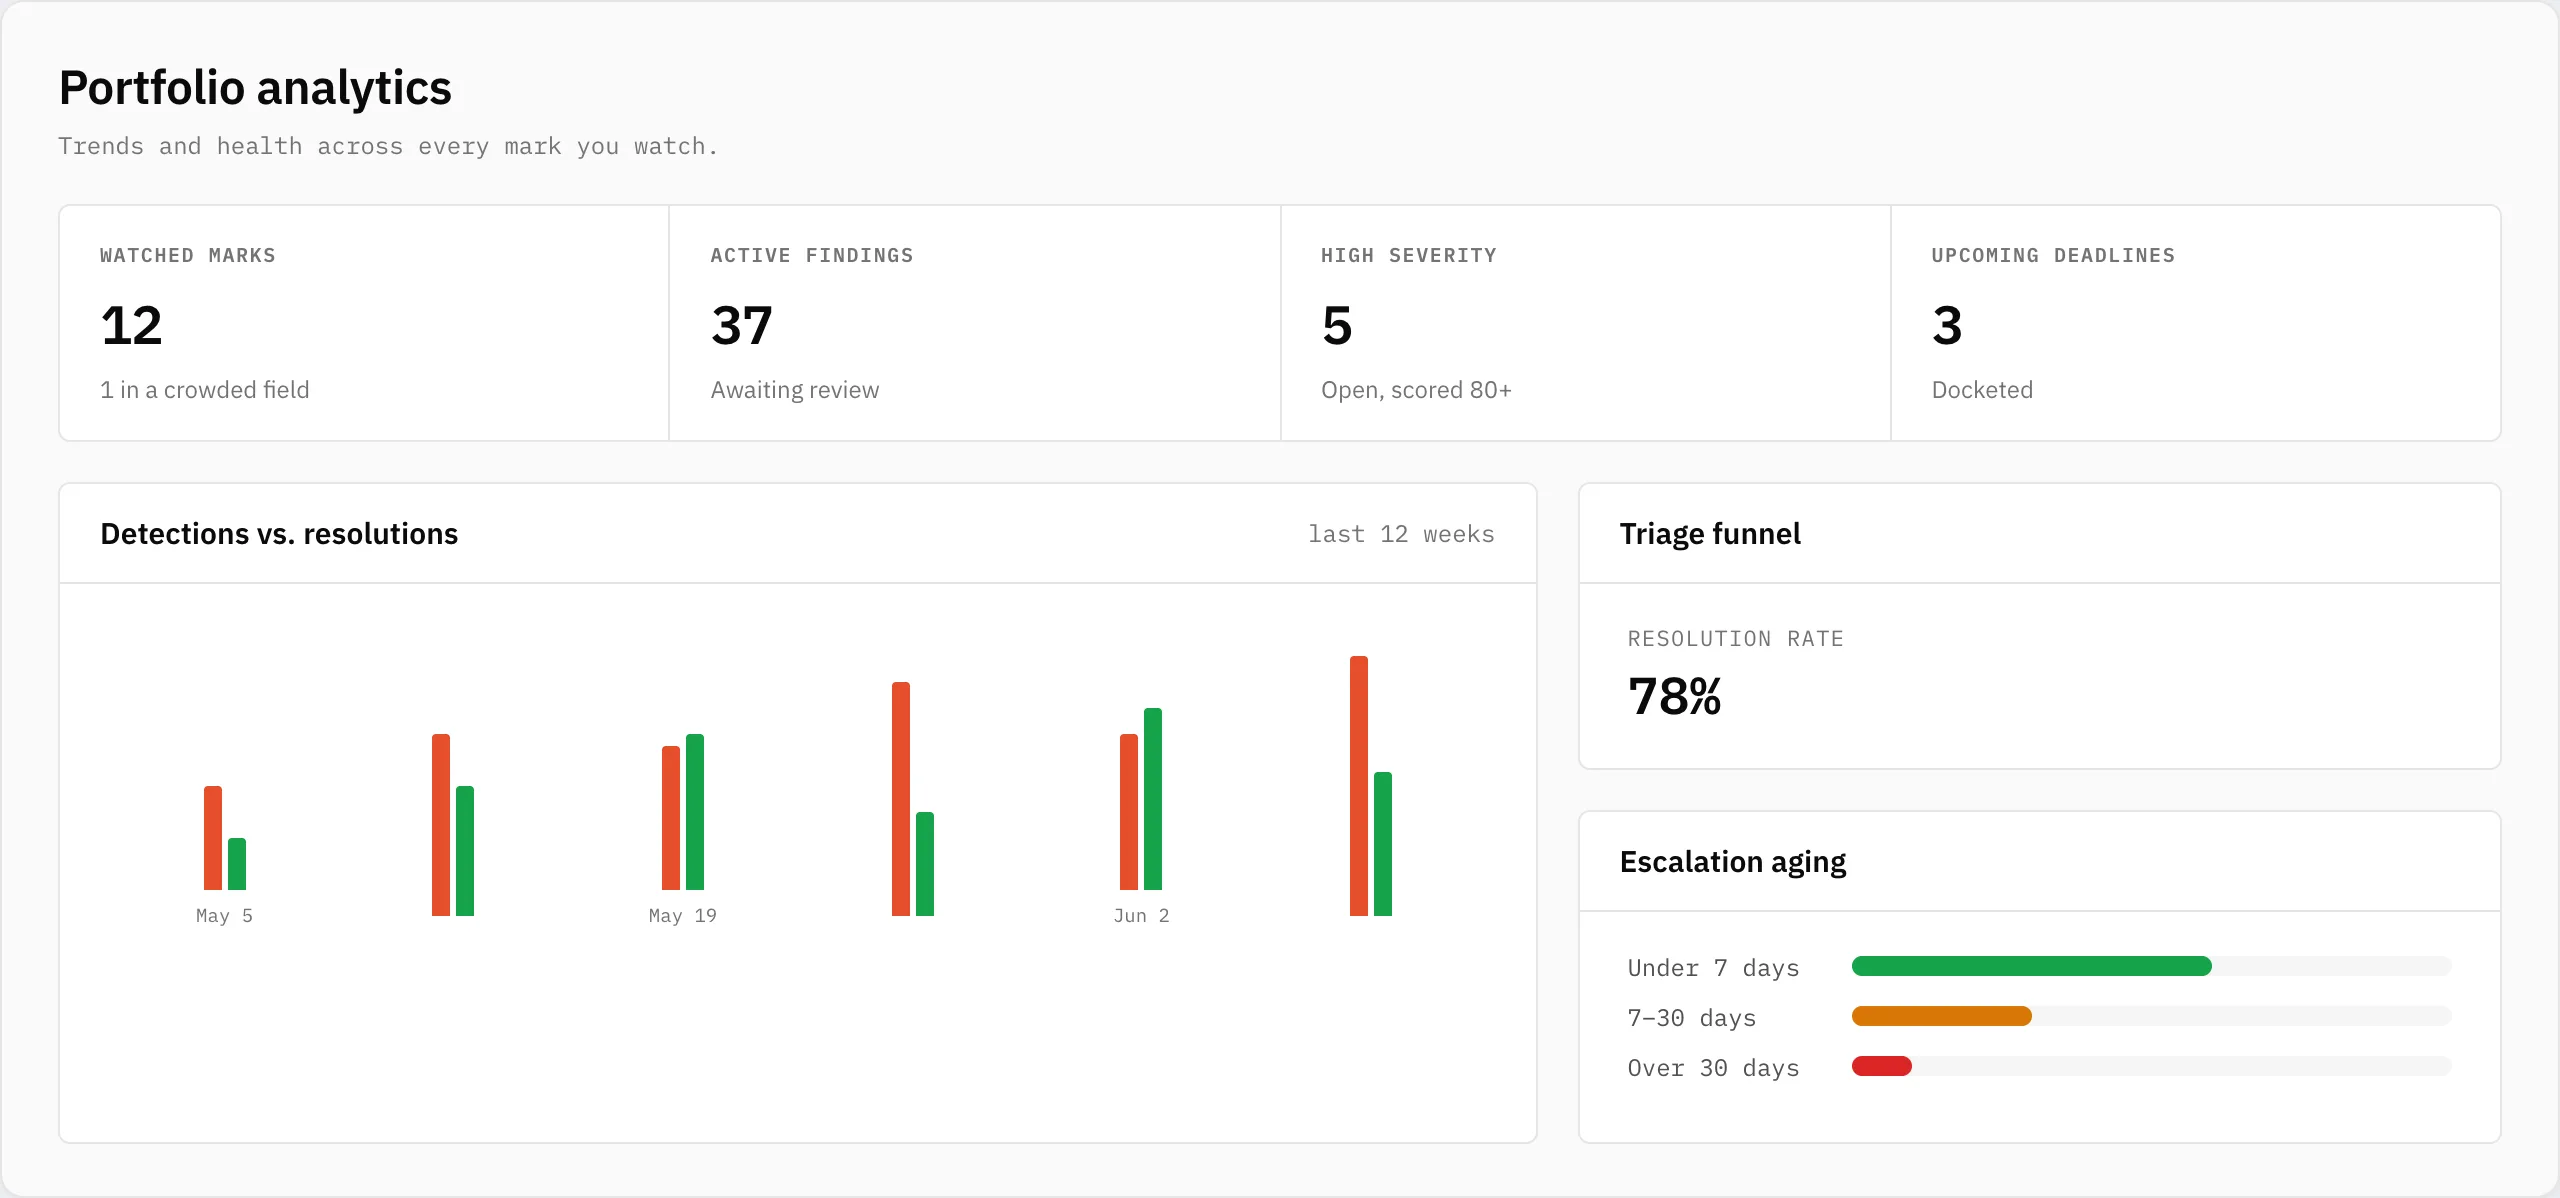
- Detections vs. resolutions — new findings against the ones you closed, week by week over the last 12 weeks. A gap that widens means work is piling up.
- Triage funnel — how your findings break down across new, escalated, resolved, and dismissed, plus a resolution rate: of the conflicts you've closed, the share you marked real rather than dismissed.
- Escalation aging — how long the conflicts in your escalated queue have been open, bucketed under 7 days, 7–30 days, and over 30. Anything in the "over 30" bucket is worth a look.
Portfolio-wide: analytics span every mark in your workspace, so it's the fastest way to see the health of the whole watch at once — not just one mark.